%%{init: {"theme": "base", "themeVariables": {"fontSize": "22px"}, "flowchart": {"nodeSpacing": 20, "rankSpacing": 60, "padding": 30, "useMaxWidth": false}}}%%
flowchart LR
    ROOT["DSIC Research Areas     "]

    subgraph s1 [" "]
      direction LR
      ML["Machine Learning     "] --> ML1["Classification & Regression     "]
      ML --> ML2["Ensemble Methods     "]
      ML --> ML3["Feature Engineering     "]
    end

    subgraph s2 [" "]
      direction LR
      DL["Deep Learning     "] --> DL1["CNNs & Transfer Learning     "]
      DL --> DL2["GANs & Image Generation     "]
      DL --> DL3["Semantic Segmentation     "]
    end

    subgraph s3 [" "]
      direction LR
      CV["Computer Vision     "] --> CV1["Medical Imaging     "]
      CV --> CV2["Defect Detection     "]
      CV --> CV3["Image Reconstruction     "]
    end

    subgraph s4 [" "]
      direction LR
      OPT["Optimization     "] --> OPT1["Loss Function Design     "]
      OPT --> OPT2["Hyperparameter Tuning     "]
    end

    ROOT --> ML
    ROOT --> DL
    ROOT --> CV
    ROOT --> OPT

    style ROOT fill:#E3F2FD,color:#1565C0,stroke:#90CAF9,stroke-width:2px
    style ML   fill:#E8F5E9,color:#2E7D32,stroke:#A5D6A7,stroke-width:2px
    style DL   fill:#FFF3E0,color:#E65100,stroke:#FFCC80,stroke-width:2px
    style CV   fill:#F3E5F5,color:#6A1B9A,stroke:#CE93D8,stroke-width:2px
    style OPT  fill:#FCE4EC,color:#C62828,stroke:#F48FB1,stroke-width:2px
    style ML1 fill:#E8F5E9,color:#2E7D32,stroke:#A5D6A7
    style ML2 fill:#E8F5E9,color:#2E7D32,stroke:#A5D6A7
    style ML3 fill:#E8F5E9,color:#2E7D32,stroke:#A5D6A7
    style DL1 fill:#FFF3E0,color:#E65100,stroke:#FFCC80
    style DL2 fill:#FFF3E0,color:#E65100,stroke:#FFCC80
    style DL3 fill:#FFF3E0,color:#E65100,stroke:#FFCC80
    style CV1 fill:#F3E5F5,color:#6A1B9A,stroke:#CE93D8
    style CV2 fill:#F3E5F5,color:#6A1B9A,stroke:#CE93D8
    style CV3 fill:#F3E5F5,color:#6A1B9A,stroke:#CE93D8
    style OPT1 fill:#FCE4EC,color:#C62828,stroke:#F48FB1
    style OPT2 fill:#FCE4EC,color:#C62828,stroke:#F48FB1
    style s1 fill:none,stroke:none
    style s2 fill:none,stroke:none
    style s3 fill:none,stroke:none
    style s4 fill:none,stroke:none
MS of Data Science & Information Computing
Graduate Institute of Data Science and Information Computing · National Chung Hsing University
Education: Master of Science, Graduate Institute of Data Science and Information Computing, National Chung Hsing University (Master of Science in Data Science and Information Computing, NCHU).
About the Program
The Graduate Institute of Data Science and Information Computing is affiliated with the College of Science at National Chung Hsing University. It was established to cultivate interdisciplinary talent with both a solid theoretical foundation in data science and practical competence in information computing. The curriculum covers machine learning, deep learning, big data analytics, image processing, optimization methods, and high-performance computing, emphasizing a complete training pipeline “from mathematics to implementation.”
The program integrates mathematical foundations with modern computing to train professionals in machine learning, deep learning, computer vision, and big data analytics. Students are equipped to bridge the gap between theoretical models and real-world applications across domains including healthcare, industry, and scientific research.
Research Focus Areas
Color Legend: Green = Machine Learning, Orange = Deep Learning, Purple = Computer Vision, Pink = Optimization. The above are the main research areas covered in the coursework.
Skills Acquired
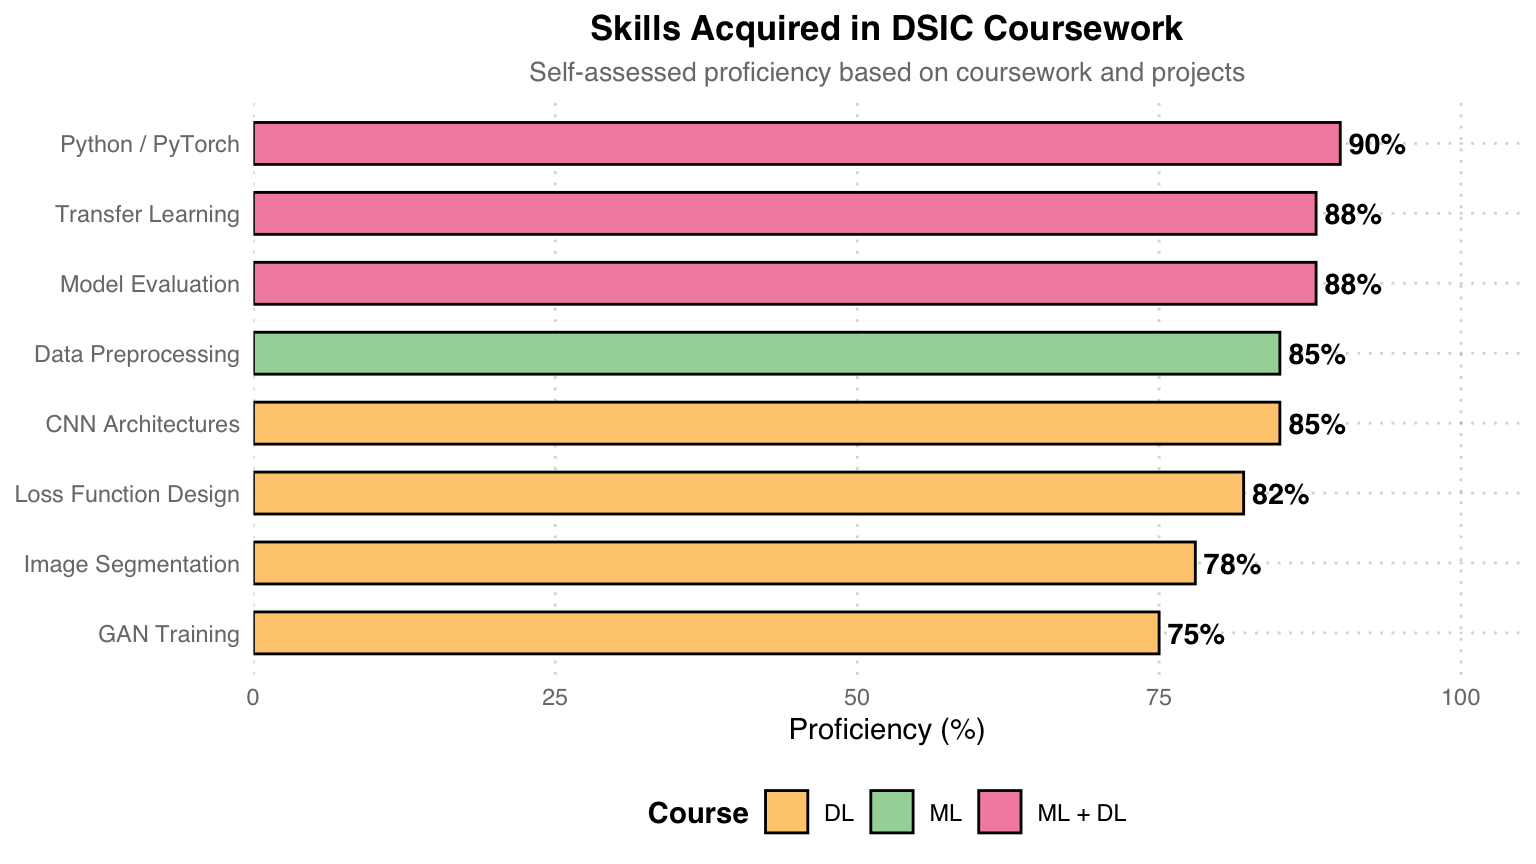
Skill Sources: Pink = Skills trained in both ML and DL courses, Teal = Primarily from ML course, Orange = Primarily from DL course. Python/PyTorch is the shared programming language across both courses, and Transfer Learning and Model Evaluation were also practiced repeatedly across courses.
Coursework
Machine Learning & Data Science
Course Focus: Supervised/Unsupervised learning, model evaluation, feature engineering, data preprocessing
Assignments:
- HW1 – Diabetes Prediction: Pima Indians diabetes prediction. Regression imputation -> Feature engineering -> DNN, from baseline 74% -> 90.04%
- HW2 – US Wildfire Analysis: 1.88 million wildfire records. Poisson regression trend analysis + MLP cause classification (45.6%)
- Final – Cervical Cancer Screening: EfficientNet-B7 transfer learning + Focal Loss, three-class image classification, average 86.1%
Key Tools: Python · Keras · scikit-learn · statsmodels · PyTorch (final)
Deep Learning
Course Focus: CNN architectures, transfer learning, semantic segmentation, image generation, autoencoders
Assignments:
- HW1 – AOI Defect Classification: ResNet-18 transfer learning, 6-class industrial defect classification, 96.44% Val Acc
- HW2 – Retinal Vessel Segmentation: U-Net (5-level) + Focal Tversky Loss, DRIVE dataset, mIoU 0.351
- HW3 – Retinal Image Reconstruction: Convolutional Autoencoder, peak PSNR 30.84 dB (Epoch 18)
- HW4 – Western Blot Generation: Conditional GAN (Generator + PatchGAN Discriminator), analyzing D/G training dynamics
Key Tools: Python · PyTorch · torchvision · Apple Silicon (MPS)
Big Data Analysis
Course Focus: Kernel method acceleration, large-scale optimization, distributed machine learning
Assignments:
- Reading – Nystrom Method: Paper reading (NIPS 2000), Gram matrix low-rank approximation, O(n^3) -> O(m^2n)
- HW – Kernel Ridge + Nystrom: USPS handwritten digit classification, m=128 achieving 20x speedup, accuracy 99.50%
- Final – Smoothed & Distributed SVM: a9a dataset, Smoothed Hinge Loss + distributed gradient aggregation (K=5 workers), 150x speedup
Key Tools: Python · NumPy · scikit-learn · SciPy (L-BFGS-B)
Mathematics for Data Analysis
Course Focus: SVD theory and applications, low-rank matrix approximation, Eckart-Young theorem, handwritten digit recognition
Assignments:
- HW1 – SVD Image Compression: Validating the Eckart-Young theorem with photographs, Monte Carlo approximation of 2-norm, PSNR reaching 44.7 dB (k=700)
- HW2 – Handwritten Digit Recognition: USPS dataset, comparing 8 methods (Mean / SVD / HOSVD / SVM / KNN / RF / CNN), CNN 95.76% highest
Key Tools: Python · NumPy · PyTorch · tensorly · scikit-learn
Project Highlights
| Course | Project | Highlight |
|---|---|---|
| Machine Learning | Diabetes Prediction | Baseline 74% -> 90.04% (+16 pp) |
| Wildfire Analysis | 1.88 million records · Poisson trend + MLP classification | |
| Cervical Cancer | EfficientNet-B7 + Focal Loss · 86.1% | |
| Deep Learning | AOI Defect Detection | ResNet-50 Fine-tune · 96.4% |
| U-Net Segmentation | Dice 0.91 · Medical image semantic segmentation | |
| AutoEncoder | Image reconstruction 30.8 dB PSNR | |
| cGAN Blot Removal | Conditional GAN for blot removal | |
| Big Data | Nystrom Approximation | Kernel Ridge 20x speedup |
| Smoothed SVM | Hinge Loss smoothing · Gradient-based solving | |
| Distributed SVM | Distributed computing 150x speedup | |
| Data Analysis Math | SVD Image Compression | Eckart-Young validation · PSNR 44.7 dB |
| Digit Recognition (8 models) | CNN 95.76% · KNN best cost-effectiveness |
Learning Journey: Starting from the mathematical foundations in Data Analysis Math (SVD, matrix approximation) -> Classical models in the ML course (regression, DNN, transfer learning) -> Advanced architectures in the DL course (U-Net, AutoEncoder, GAN) -> Large-scale acceleration methods in Big Data (Nystrom, Smoothed SVM, distributed computing). Each project covers a complete pipeline – from data preprocessing, model design, training, to result analysis and visualization.